DIY EKG Using Arduino and Javascript
An EKG (electrocardiogram) - also referred to as an ECG - is a recording of the electrical activity of the heart. This can be used for measuring the rate and regularity of heart beats. Using a readily available Arduino shield, an Arduino and a $10 set of electrodes, it’s possible to generate this waveform at home and then manipulate and plot it in realtime using Javascript.
First the obligatory disclaimer. Nothing here is suitable for medical use. The EKG shield being used has not been certified for medical use and I have no medical training at all. Attaching electrodes to yourself could result in electric shock or seizure, continue at your own risk!
Now the fun part. The parts used here are:
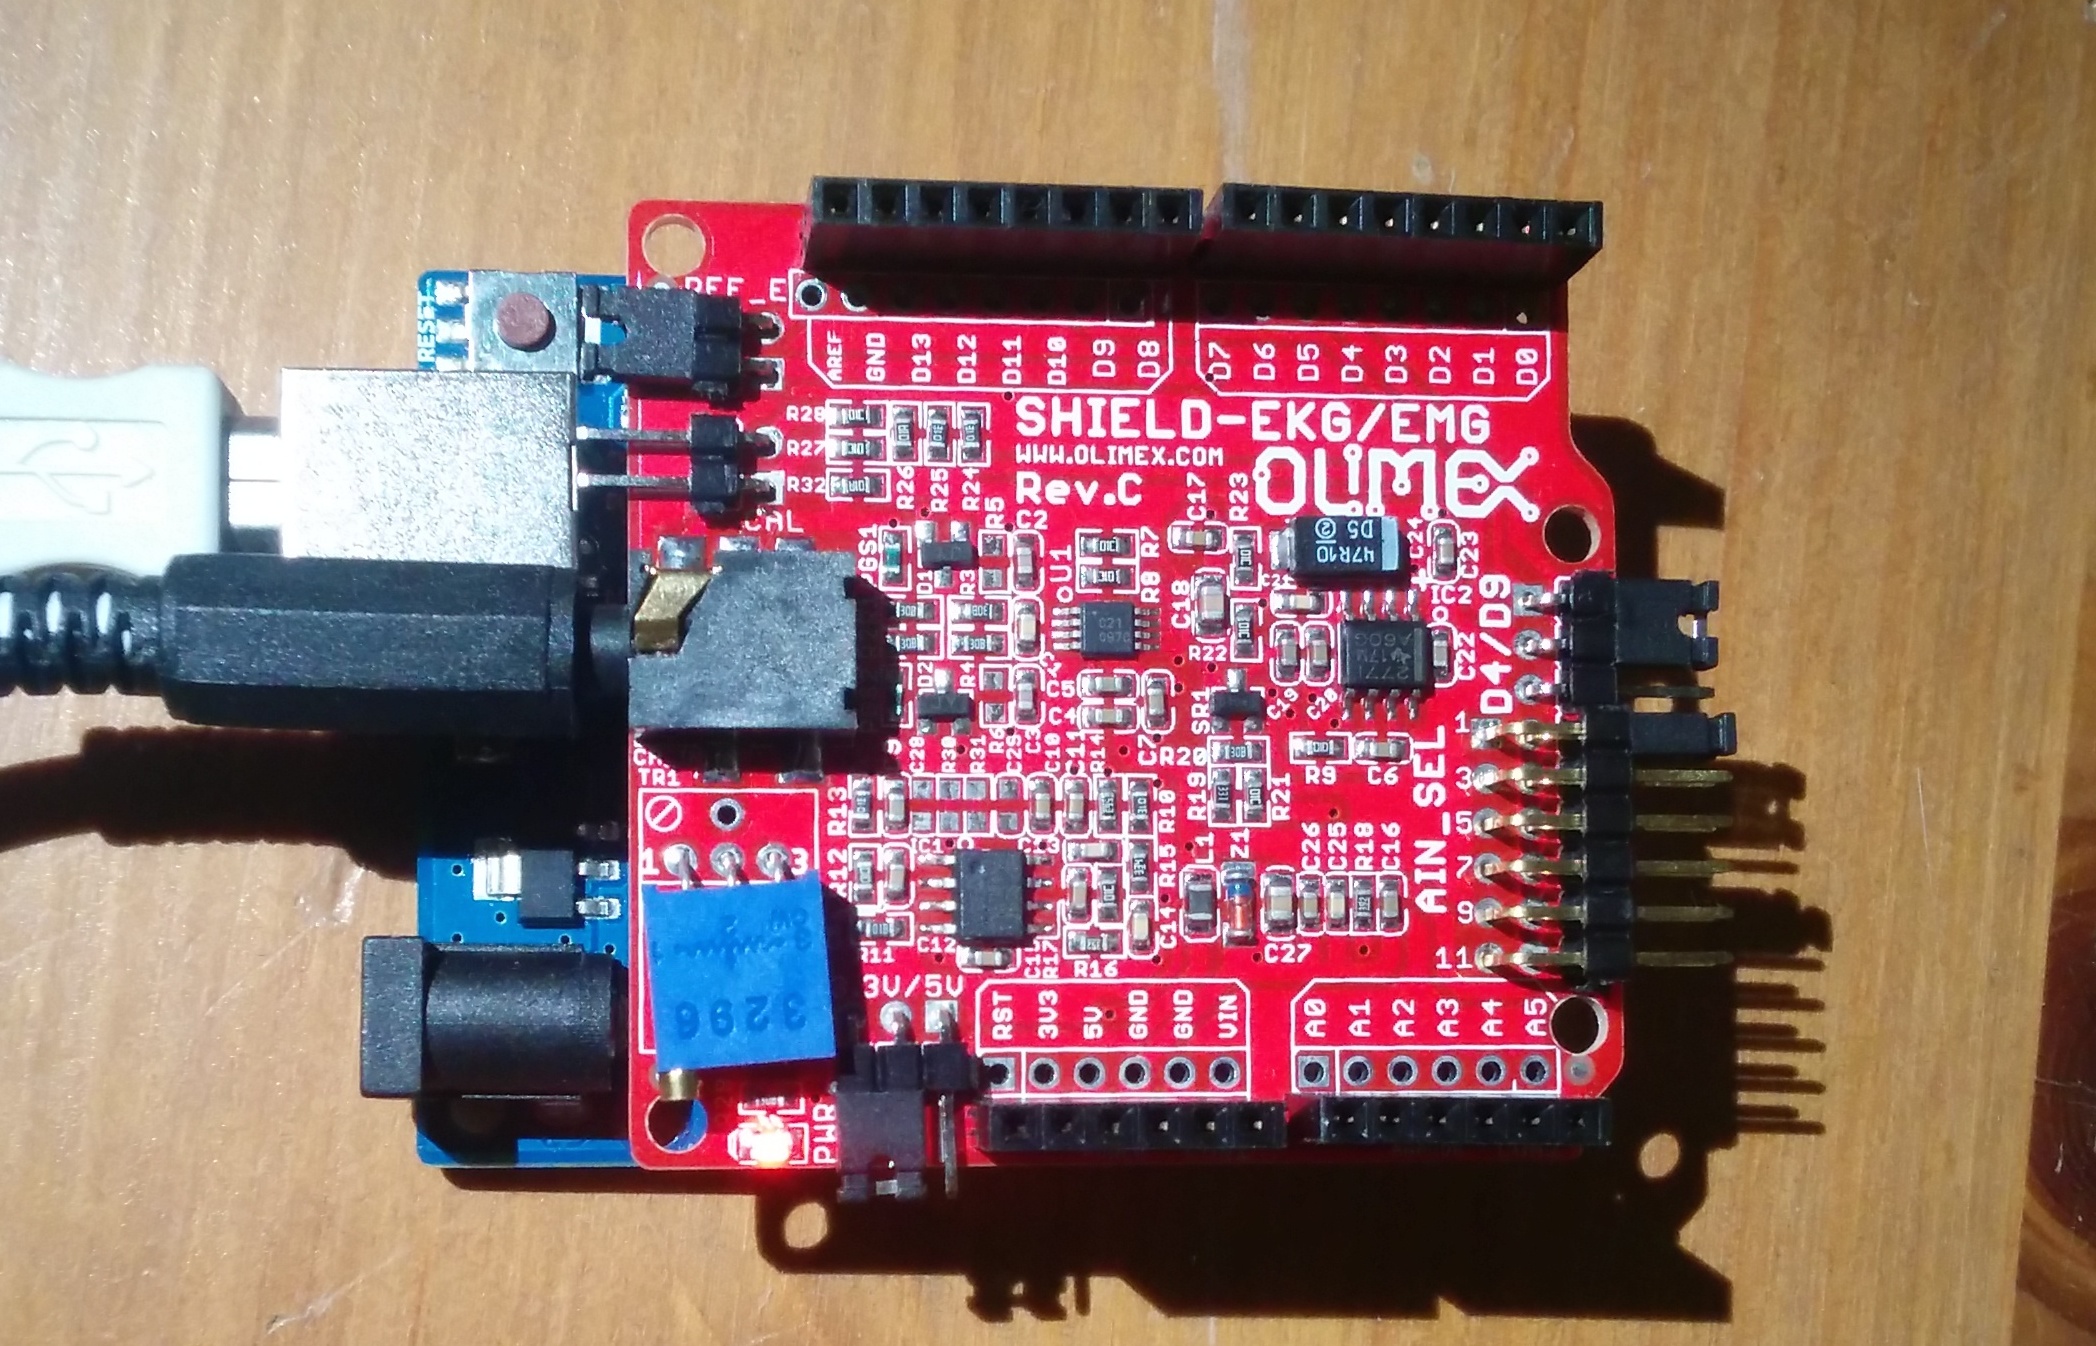
- An Olimex EKG Shield https://www.olimex.com/Products/Duino/Shields/SHIELD-EKG-EMG/ which can be ordered directly through them and is often also available on Ebay and Amazon.
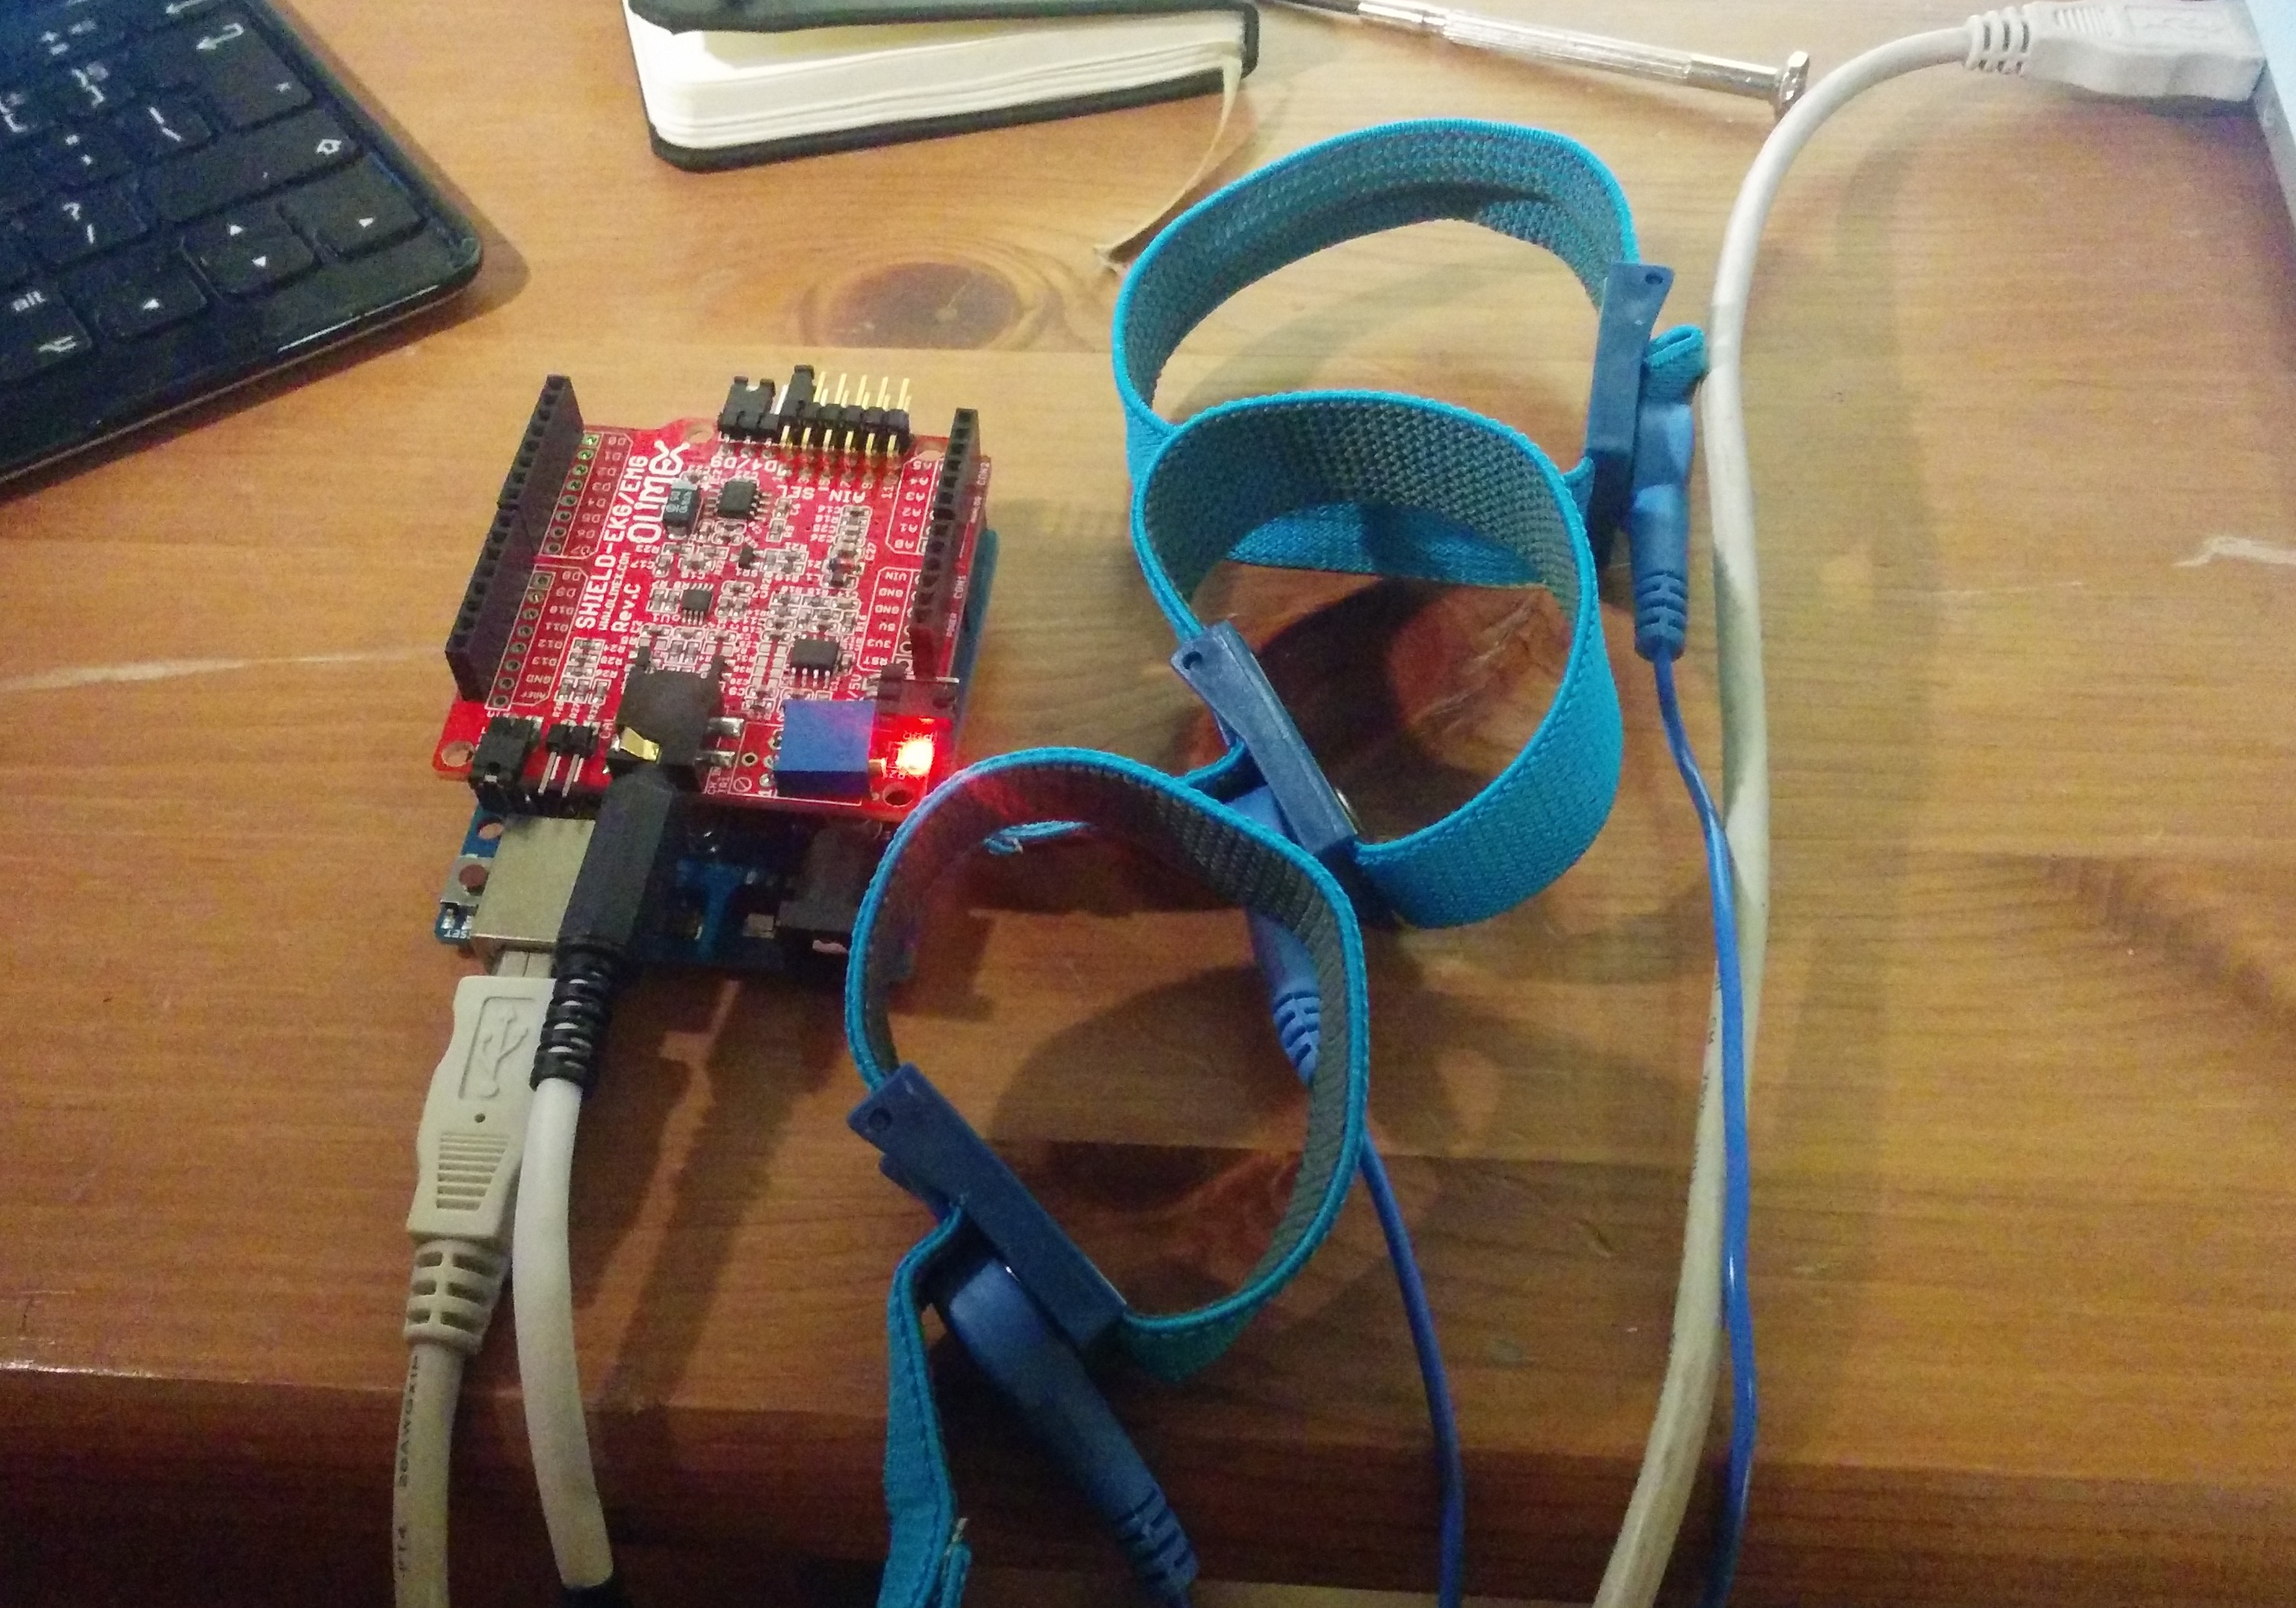
- A set of three electrodes designed for this board https://www.olimex.com/Products/Duino/Shields/SHIELD-EKG-EMG-PA/open-source-hardware again, also available on Ebay and Amazon.
- A standard Arduino Uno http://arduino.cc/en/Main/arduinoBoardUno.
This was built on OSX but it uses a Google Chrome App to interface with the Arduino so should work on any platform which supports these. That should include both Linux and Windows but I haven’t tested the code on either.
The manual for the Olimex board is excellent and available here. It covers the jumper configurations required for basic use, the configuration I used can be seen below.
The Arduino sketch they provide is responsible for reading from the analogue inputs associated with the shield and then writing this data out to the Serial port. It’s worth noting two things about the sketch:
- The serial port is set to 57600bps not the usual 9600
- The data is written in binary format rather than text so cannot be viewed using the standard Arduino Serial monitor
The viewing software they provide is windows only and my end goal wasn’t just to stream the data, it was to automate acquiring and analysing it. This meant writing my own.
My favourite tool at the moment for working with an Arduino is a Chrome App these allow native-like apps to be created using standard html and javascript. These apps can do far more than a standard web page, including accessing serial devices.
The source code for my simple chrome app which reads in data from the Arduino and charts it in realtime is available here https://github.com/TalkingQuickly/ekg-arduino-chrome.
This provides output which looks like this:
To install the app in Chrome, clone the repository and then see the “Load the extension” section section of this page.
Next install the sketch available here https://github.com/TalkingQuickly/ekg-arduino-chrome-sketches to the Arduino.
The Arduino sketch sends packets of data as a stream of bytes in the following format:
{
  uint8_t sync0;    // = 0xa5
  uint8_t sync1;    // = 0x5a
  uint8_t version;  // = 2 (packet version)
  uint8_t count;    // packet counter. Increases by 1 each packet.
  uint16_t  data[6];  // 10-bit sample (= 0 - 1023) in big endian (Motorola) format.
  uint8_t switches; // State of PD5 to PD2, in bits 3 to 0.
};
This means 17 bytes in total, with the first two being 165,90 and the last being a 1. The Chrome App is responsible for breaking the incoming stream of bytes into valid packets.
Each of the analogue readings within a packet are stored as unsigned 16bit integers meaning they need to be reconstructed from the pairs of bytes received.
This function (found on Stack Overflow can be used to do this:
byteArrayToLong = function(/*byte[]*/byteArray) {
    var value = 0;
    for ( var i = byteArray.length - 1; i >= 0; i--) {
        value = (value * 256) + byteArray[i];
    }

    return value;
};
We can see from the comments in the Arduino sketch that these are sent in the form high byte, low byte:
TXBuf[4] = 0x02;    //CH1 High Byte
TXBuf[5] = 0x00;    //CH1 Low Byte
TXBuf[6] = 0x02;    //CH2 High Byte
TXBuf[7] = 0x00;    //CH2 Low Byte
TXBuf[8] = 0x02;    //CH3 High Byte
TXBuf[9] = 0x00;    //CH3 Low Byte
TXBuf[10] = 0x02;   //CH4 High Byte
TXBuf[11] = 0x00;   //CH4 Low Byte
TXBuf[12] = 0x02;   //CH5 High Byte
TXBuf[13] = 0x00;   //CH5 Low Byte
TXBuf[14] = 0x02;   //CH6 High Byte
TXBuf[15] = 0x00;   //CH6 Low Byte
Therefore to get the first channel we can simply call byteArrayToLong([TXBuf[5], TXBuff[4]]), e.g. with the low byte first.
The app then uses CanvasJS to chart the data in realtime. At the moment only one channel is displayed.
Arguably the hardest part of this project was getting adequate contact between the electrodes and the skin. Another warning, connecting electrodes to yourself has the potential to result in electric shock or seizures, continue at your own risk.
The configuration which I’ve had the most success with is the L and R electrodes on the inside of my left and right wrists and the the D electrode on my ankle. I’ve found it’s very important that the ones on the wrist are tight and that a small layer of shower gel helps to maintain a constant connection.
Next steps:
- Automatic peak detection
- Heart Rate Calculation
- Heart Rate Variability Calculation
This presentation http://www.slhn.org/docs/pdf/prehosp-drkasarda1.pdf is useful for getting a feel for roughly how an EKG works and what each part of the waveform represents.

Ben Dixon
My name's Ben Dixon, I'm the co-founder of Sona where we're building the operating system for the worlds deskless workforce. I'm an experienced CTO, LLM geek, lover of good coffee and above all, making things. Also a regular conference speaker, author and travel addict. Chat to me on twitter @talkingquickly